Mini Project: Infrastructure Monitoring with CloudWatch
2.1 Project Overview and Business Context
This project demonstrates how to implement infrastructure monitoring and alerting using AWS CloudWatch and Amazon SNS. The system monitors the performance and health of an EC2 instance by tracking key metrics such as CPU utilization.
CloudWatch alarms are configured to trigger when CPU usage exceeds a defined threshold. When the threshold is reached, the alarm sends a notification through Amazon SNS, which delivers an email alert to the system administrator.
This setup provides a simple but effective monitoring solution that helps teams detect performance issues early and maintain system reliability.
Business Context
Monitoring and alerting are critical components of modern cloud infrastructure. Without proper monitoring, organizations may not detect performance issues or system failures until users experience disruptions.
By implementing automated monitoring and alerts, organizations can:
Detect performance issues early
Maintain application availability
Respond quickly to infrastructure problems
Improve operational reliability
Cloud monitoring solutions like Amazon CloudWatch are commonly used by DevOps teams to maintain system health and ensure consistent application performance.
Architecture Components
Compute Layer: Amazon EC2 hosts the application being monitored.
Monitoring Layer: Amazon CloudWatch collects performance metrics such as CPU utilization.
Alerting Layer: CloudWatch Alarms evaluate metrics against defined thresholds.
Notification Service: Amazon SNS sends email alerts when alarms are triggered.
Services Used
Amazon EC2 – Hosts the compute resource being monitored. (Compute)
Amazon CloudWatch – Collects metrics and monitors infrastructure performance. (Monitoring)
CloudWatch Alarms – Triggers alerts based on defined metric thresholds. (Observability)
Amazon SNS – Sends notifications to administrators when alarms occur. (Messaging)
2.3 Setup VPC and Networking
Steps to be Performed 👩💻
Create a VPC
Create a Public Subnet
Create an Internet Gateway (IGW)
Configure Route Tables
Configure Security Groups
#1 Create a VPC
To create a secure and isolated environment for your application and database, we'll set up a Virtual Private Cloud (VPC) and configure networking components, ensuring high availability with multiple subnets across two availability zones.
Log in to the AWS Management Console.
Navigate to the VPC Dashboard.
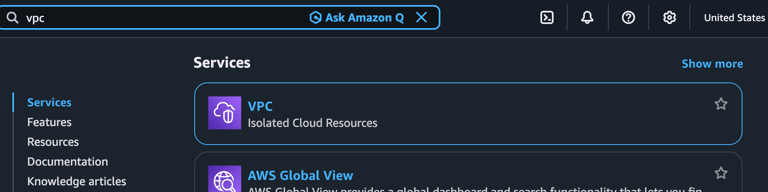
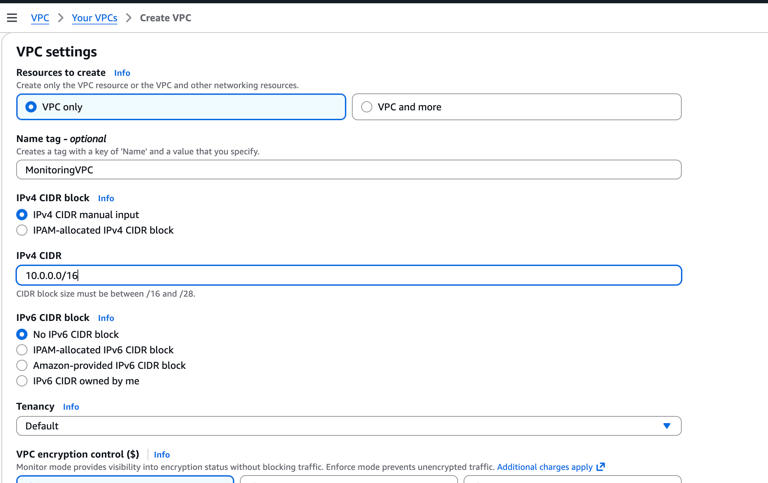
Click Create VPC and select VPC only.
Configure the following settings:
Name tag: MinitoringVPC
IPv4 CIDR block: 10.0.0.0/16
IPv6 CIDR block: No IPv6 CIDR block.
Tenancy: Default.
Click Create VPC.
#2 Create Public and Private Subnets
Create four subnets across two availability zones—two subnets for the application layer (public subnets) and two subnets for the database layer (private subnets).
For Availability Zone 1 (us-east-1a):
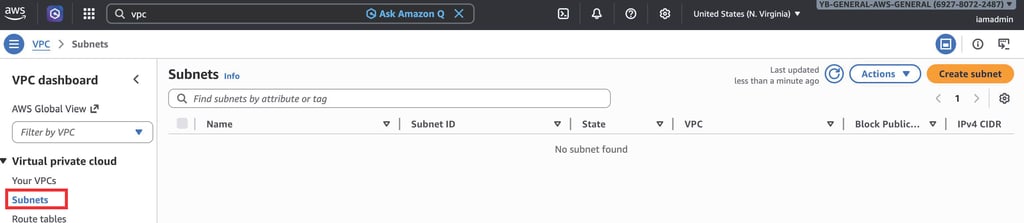
Go to Subnets right underneath VPC and click Create subnet
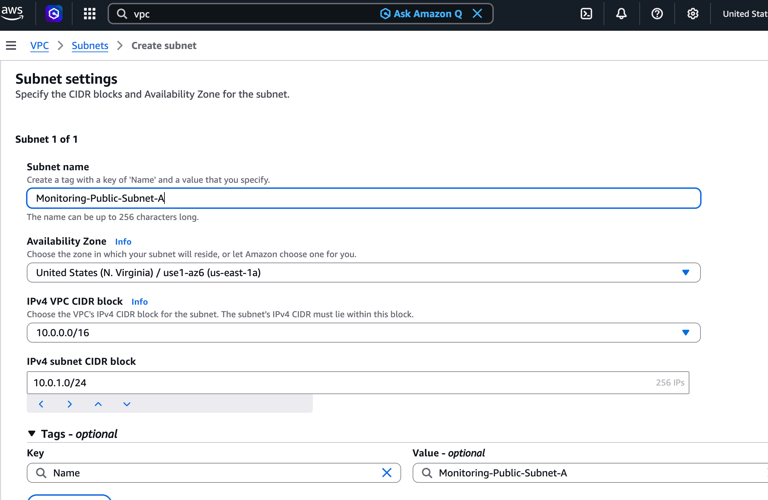
Configure the following settings for the public subnet:
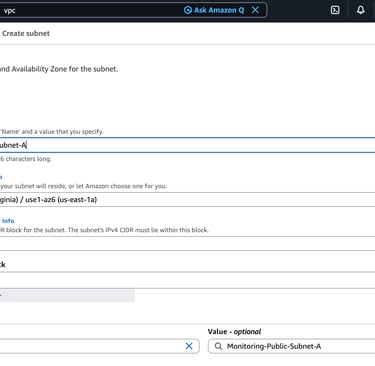
Name tag: Monitoring-Public-Subnet-A
VPC ID: Select MonitoringVPC
Availability Zone: us-east-1a
IPv4 CIDR block: 10.0.1.0/24
Enable Public IP Assignment
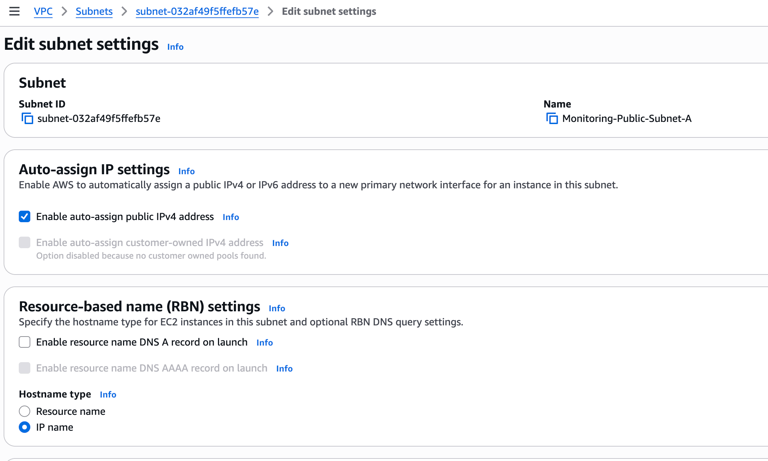
Navigate to Subnets.
Select monitoring-public-subnet.
Click Edit subnet settings.
Enable:
Auto-assign public IPv4 address
Save the changes.
This allows EC2 instances launched in the subnet to receive a public IP address.
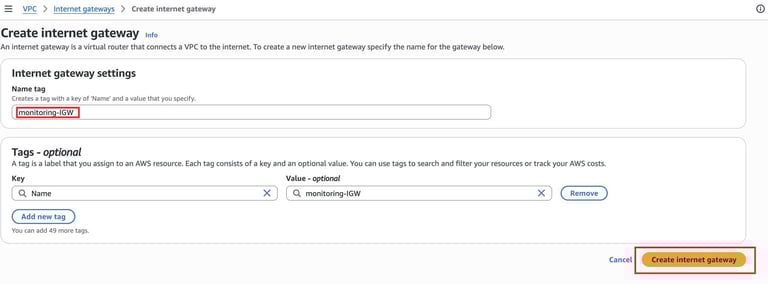
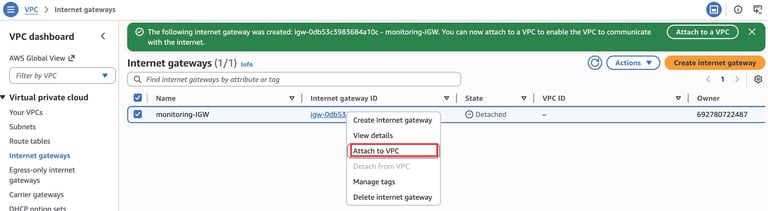
Create an Internet Gateway (IGW)
Go to Internet Gateways in the VPC Dashboard.
Click Create internet gateway.
Enter a name tag: Monitoring-IGW.
Click Create internet gateway.
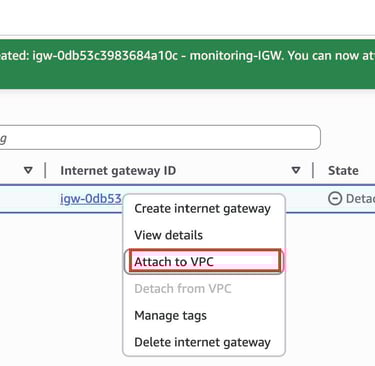
Attach the IGW to the MonitoringVPC
Select the created IGW.
Click Actions or simply right click and choose> Attach to VPC and choose MonitoringVPC
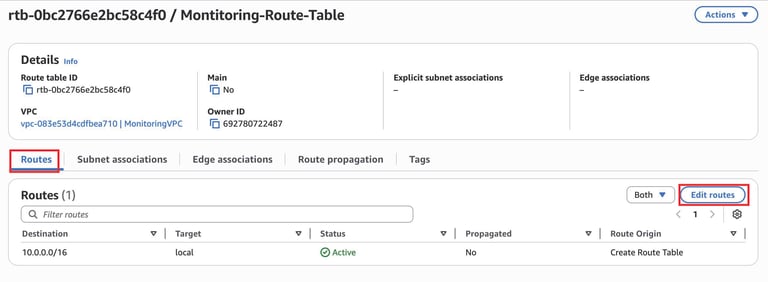
Configure Route Tables
We need to configure Route tables to handle the communication between these subnets. To do this-
For Public Subnets:
1. In the VPC Dashboard, go to Route Tables.
2. Click Create route table.
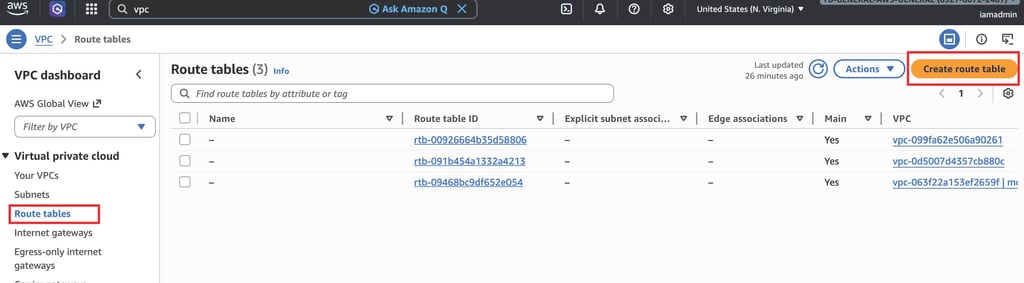
3. Configure the following settings:
Name tag: Monitoring-Public-Route-Table
VPC: Select MonitoringVPC
4.Click Create Route table
5. Add a route to the IGW:
Select the route table and click the Routes tab.
Click Edit routes and add:
Destination: 0.0.0.0/0.
Target: Select the Mintoring-IGW.
Click Save routes.
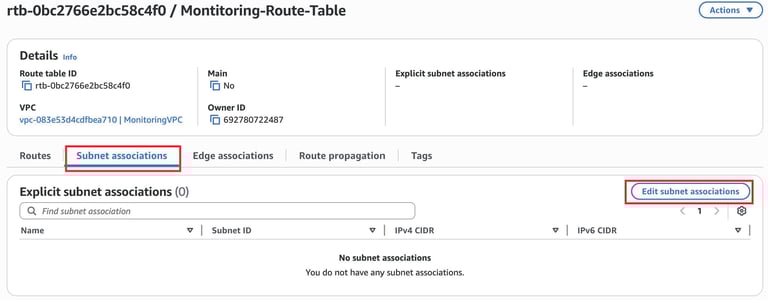
6. Associate the Route Table with the Subnet
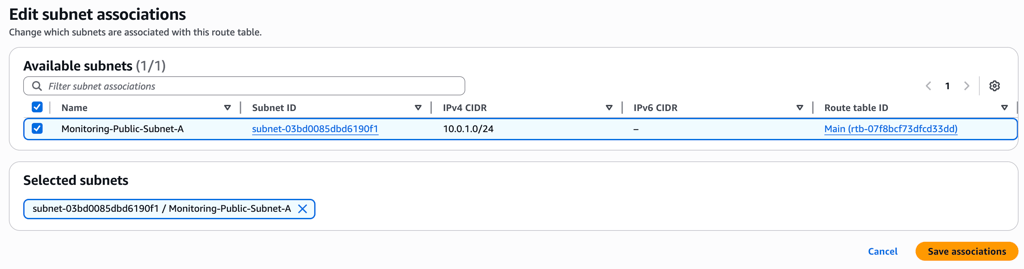
In monitoring-public-route-table, open the Subnet Associations tab.
Click Edit Subnet Associations.
Select Monitoring-Public-Subnet-A.
Save.
This makes the subnet publicly accessible.
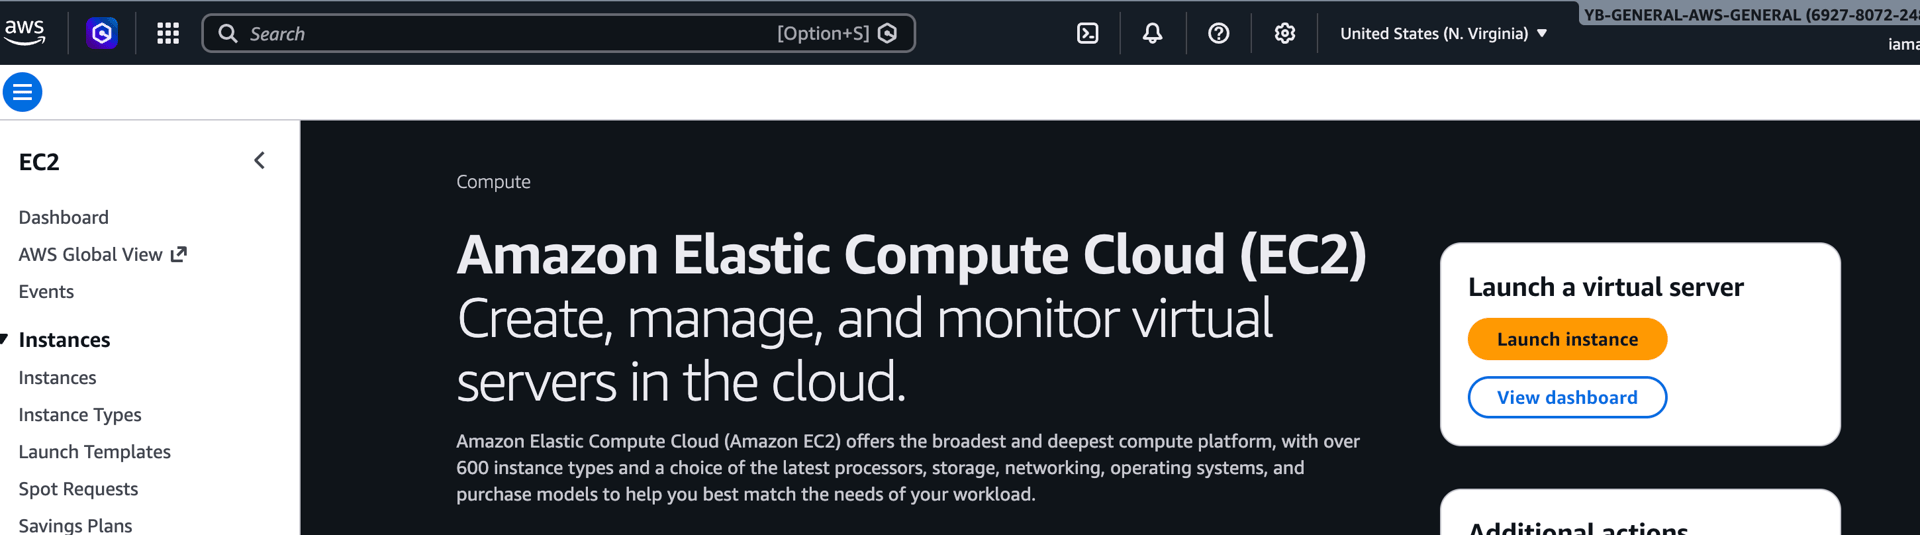
7. Launch an EC2 Instance
Navigate to EC2 Dashboard.
Click Launch Instance.
Configure:
Name: Monitoring-instance
AMI: Amazon Linux
Instance Type: t2.micro
VPC: MonitoringVpc
Subnet: Monitoring-public-subnet-A
Auto Assign Public IP: Enabled
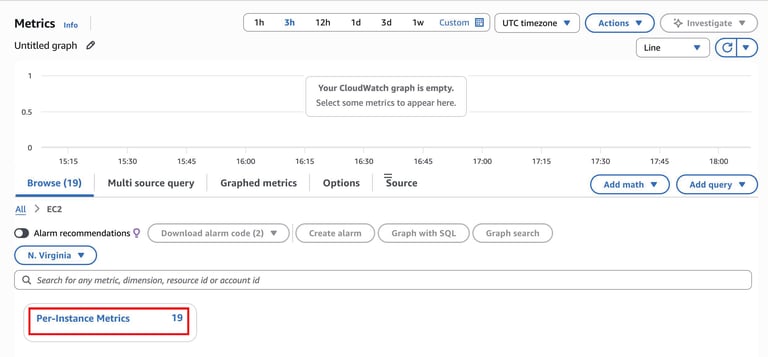
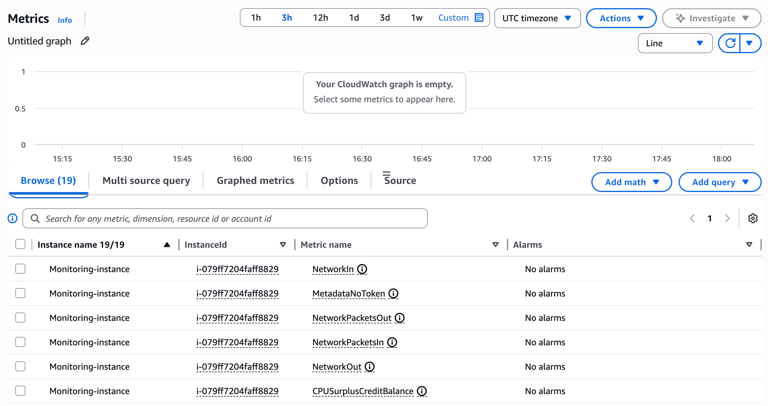
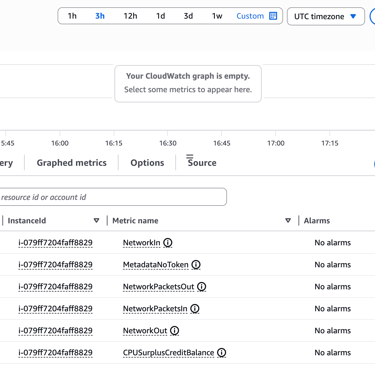
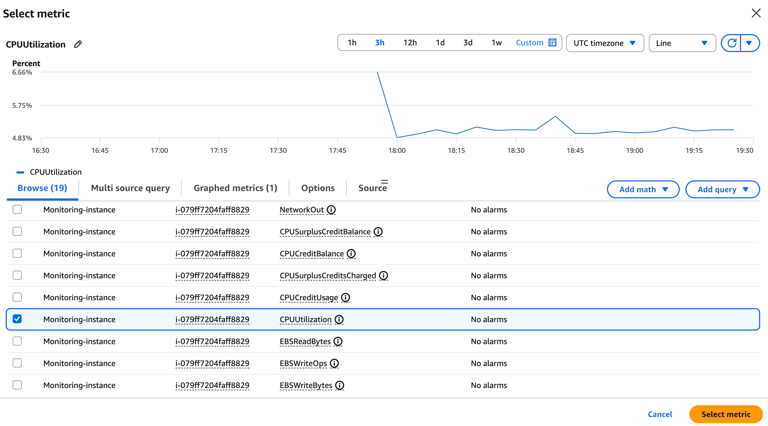
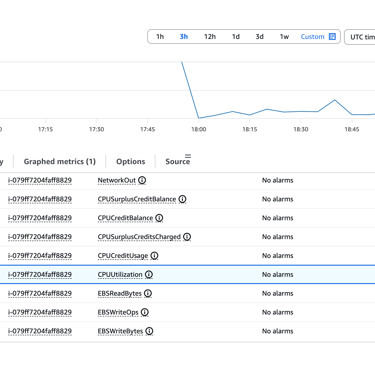
8. Verify CloudWatch Metrics
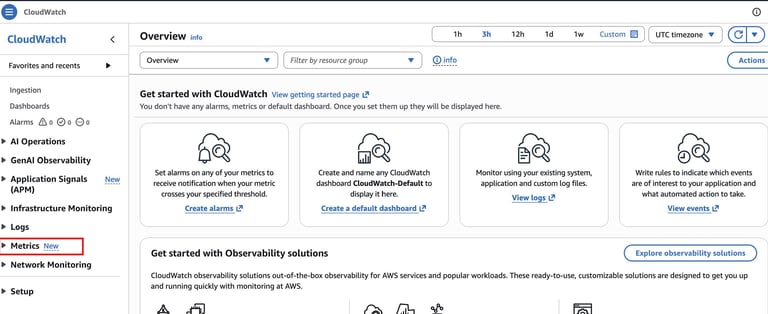
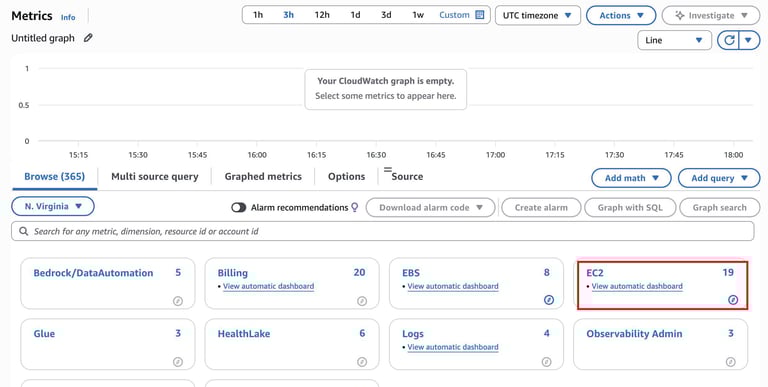
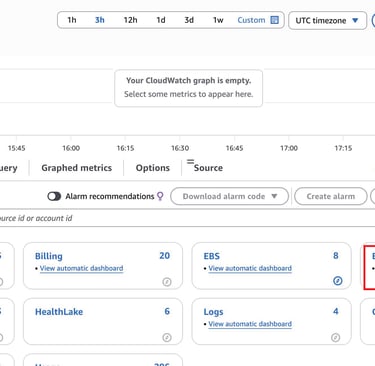
Open the CloudWatch Console.
Navigate to Metrics.
Select
EC2 → Per-Instance Metrics
Locate the metrics for your EC2 instance.
Common metrics include:
CPUUtilization
NetworkIn
NetworkOut
DiskReadOps
DiskWriteOps
These metrics provide real-time monitoring data for the instance.
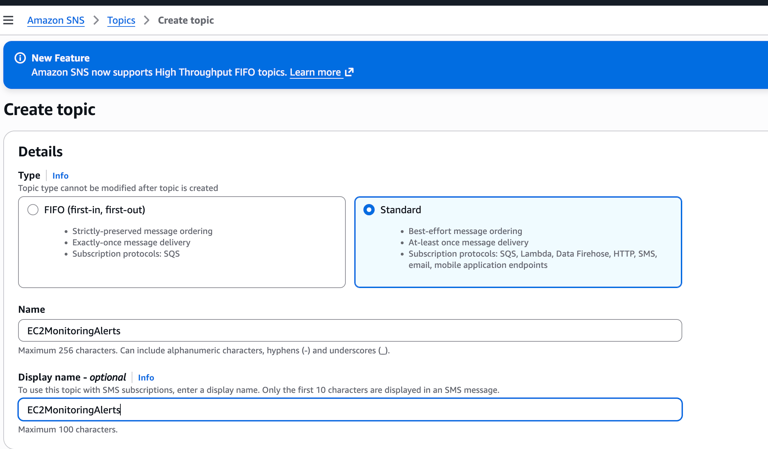
9. Create an SNS Topic
Navigate to Amazon SNS in the AWS Console.
Click Create Topic.
Select Standard topic.
Configure:
SettingValueNameEC2MonitoringAlerts
Click Create Topic.
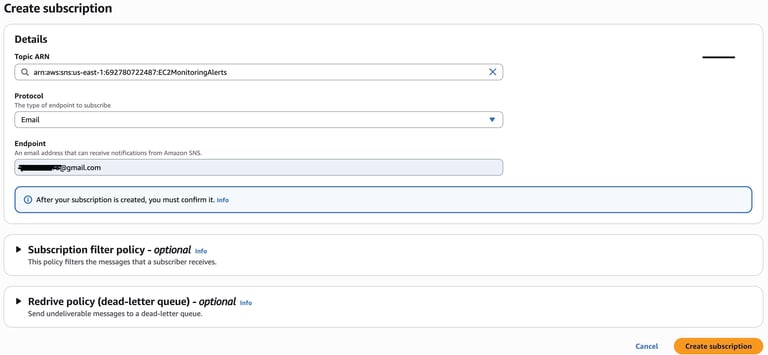
10. Create an Email Subscription
Open the SNS topic EC2MonitoringAlerts.
Click Create Subscription.
Configure:
Protocol: Email
Endpoint: your-email-address
Click Create Subscription.
Check your email inbox.
Click Confirm Subscription in the SNS email.
This enables email notifications for CloudWatch alerts.
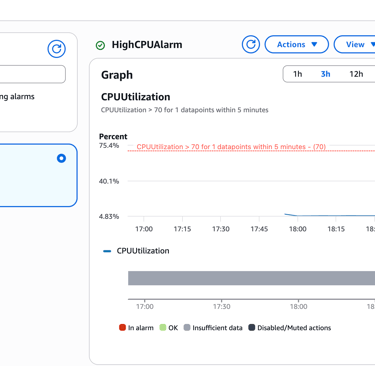
11. Create a CloudWatch Alarm
Navigate to CloudWatch → Alarms.
Click Create Alarm.
Select metric:
EC2 → Per-Instance Metrics → CPUUtilization
Configure threshold:
Example: CPU Utilization > 70% for 5 minutes
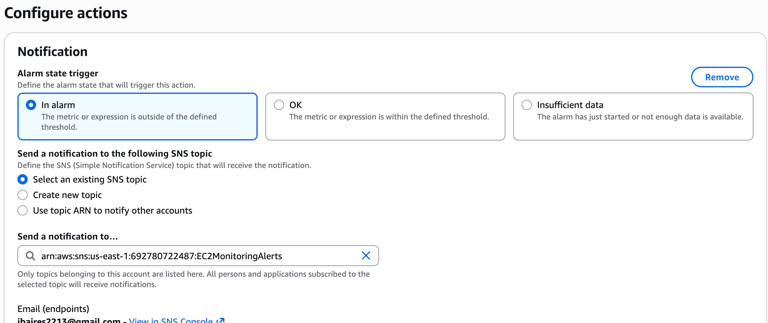
Under Notification, select:
SNS Topic → EC2MonitoringAlerts
Name the alarm:
HighCPUAlarm
Click Create Alarm.
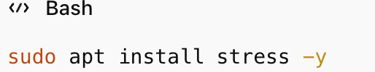
To trigger a CloudWatch alarm at 70% CPU utilization, you need to temporarily create CPU load on your EC2 instance. The easiest way is to use a small Linux tool that stresses the CPU.
Method 1 (Recommended): Use stress to Generate CPU Load
1. Connect to Your EC2 Instance
connect using instance connect:
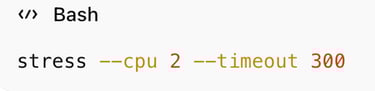
This should push the CPU utilization above 70%, which should trigger your CloudWatch alarm.
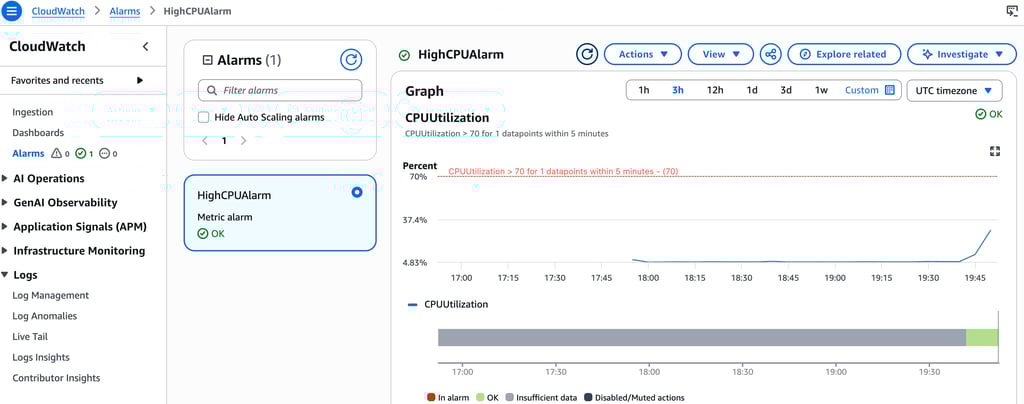
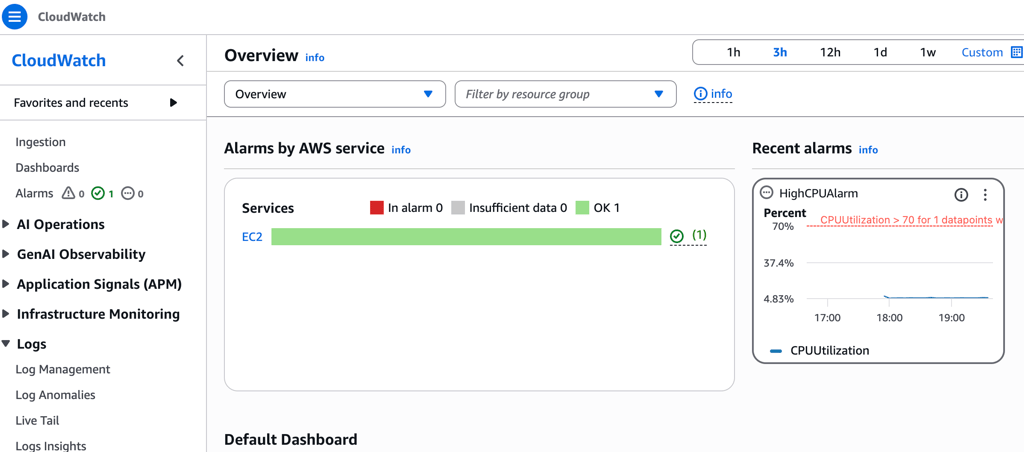
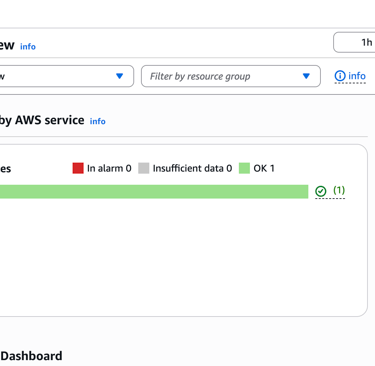
Monitor CloudWatch
Go to:
AWS Console → CloudWatch → Metrics → EC2 → Per-Instance Metrics
Look at:
CPUUtilization
You should see the CPU spike.
Your alarm should change state:
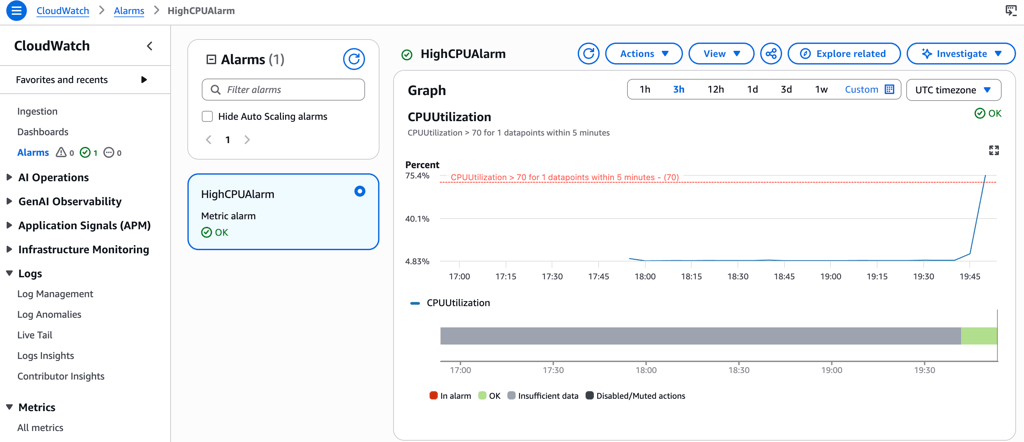
Once your instance reaches the 70% CPU utilization, an alarm will be triggered and it should send you and email alerting you of the usage.
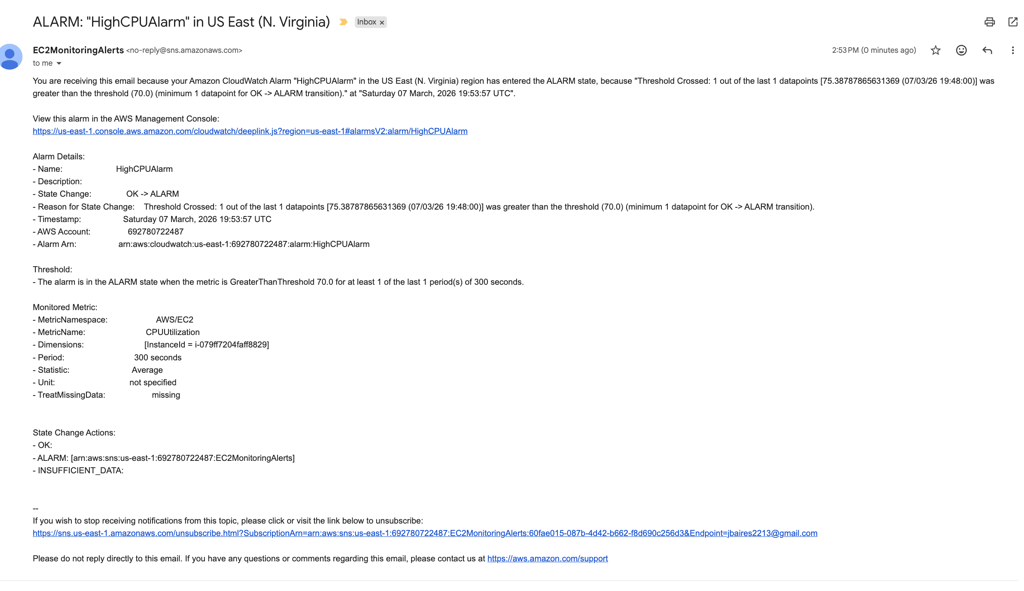
After the 5 minutes finish, CPU usage will drop and the alarm should return to:
12. Result
When the EC2 instance exceeds the defined threshold:
CloudWatch detects the metric spike.
The CloudWatch alarm is triggered.
SNS sends an email notification.